

The following is our summary of TRREB's August 2026 Market Watch report. The story this month is supply, not demand: inventory across the Greater Toronto Area pulled back sharply, and sales eased alongside it — arguably held back by how little there was to choose from in some neighbourhoods. Here's a full breakdown of the numbers.
Click here to view TRREB's full charts and statistics
Real Estate Market Watch: Residential Transactions
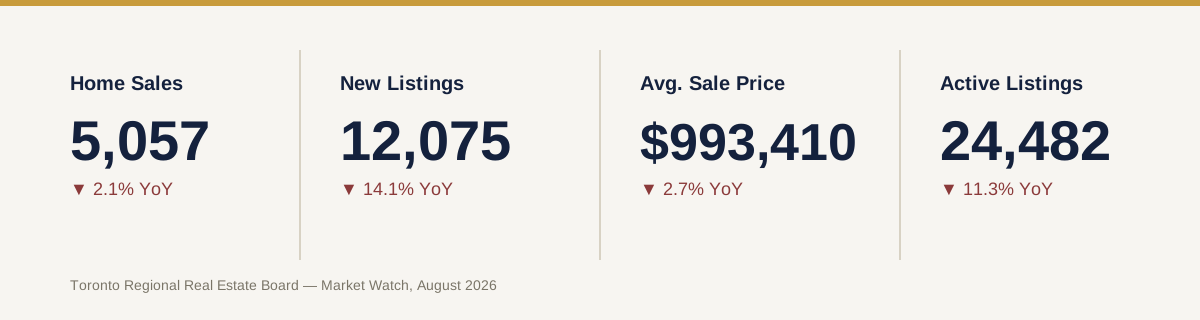
- 5,057 residential transactions closed in August 2026, down 2.1% from August 2025.
- On a seasonally adjusted month-over-month basis, sales dipped slightly compared to July 2026.
- Estimated total dollar volume for the month came in just above $5.0 billion.
August 2026 Real Estate News: Average Selling Prices
- The average selling price for August 2026 was $993,410 — down 2.7% year-over-year, and the second time this year the GTA average has slipped below $1 million.
- Median selling price: $850,000.
- The MLS® Home Price Index (HPI) Composite benchmark, which adjusts for the mix of homes sold, was down 4.5% year-over-year — a steeper drop than the average price alone shows.
- Month-over-month and seasonally adjusted, the HPI Composite was essentially flat versus July, while the average price ticked slightly higher.
Monthly Market Update: New Listings and Inventory
- New listings totalled 12,075 in August, down 14.1% year-over-year.
- Active listings at month-end came in around 24,482, down 11.3% from a year earlier.
- The sales-to-new-listings ratio has been trending up toward the high-30s, putting several GTA regions on the edge of balanced-market territory.
- New listings actually rose month-over-month on a seasonally adjusted basis — a sign some sellers are already reacting to thinner competition.
Days on the Market
- Average property days on market: 51, up from 49 a year earlier (+4.1%).
- Average listing days on market: 35, up from 33 a year earlier (+6.1%).
- Sellers are still fetching close to full asking price across most of the GTA.
Sales and Average Price by Home Type
- Detached: roughly flat to slightly up in sales volume, averaging around $1,288,669 (down modestly year-over-year). Toronto proper outperformed the surrounding 905 region.
- Semi-detached: sales nudged higher while the average price eased to roughly $931,665.
- Townhouse: the softest segment this month, with both sales and average price ($786,817) down noticeably year-over-year.
- Condo apartments: sales edged lower overall, but City of Toronto condos held up meaningfully better than the surrounding 905 markets, both on volume and price.
The Economic Backdrop
- Interest rates and inflation have stayed relatively stable through the summer, keeping carrying costs roughly steady for buyers.
- Employment and broader economic data have been modestly positive.
- Ongoing uncertainty around U.S. trade policy continues to sit in the background as a factor households are weighing before committing to a purchase.
What TRREB Is Saying
TRREB's leadership framed August as a market at an inflection point: if inventory keeps tightening, buyers may increasingly face a choice between waiting for more economic clarity and buying before prices firm up — while better conditions for sellers could eventually draw more listings back to market and ease the squeeze. Ownership housing has remained relatively affordable over the past year thanks to softer prices and steady borrowing costs, though trade-related uncertainty remains the main hesitation for many households. Board leadership also reiterated that a more balanced resale market doesn't solve the region's deeper supply and affordability challenges, and continues to call for movement on zoning, development charges, and approval timelines.
What This Means for Buyers and Sellers
For buyers: the wide selection you may have gotten used to over the past year is narrowing. Active listings are down more than 11% year-over-year, and price benchmarks are essentially flat month-over-month — often an early signal that steady declines are levelling off. If you've been waiting for the bottom, keep in mind that shrinking choice tends to show up before rising prices do.
For sellers: fewer competing listings works in your favour, but buyers are still taking their time — homes are averaging 51 days on market. Pricing accurately from day one remains the difference between a quick, clean sale and a listing that goes stale.
For investors: location within the GTA is doing more of the work than it has in years. City of Toronto condos are outperforming the surrounding 905 markets on both price and sales, making core-area positioning worth a closer look this cycle.
This summary is for general informational purposes only and does not constitute legal, financial, or tax advice. Always consult a licensed real estate professional before making a decision.
Sources: Toronto Regional Real Estate Board (TRREB), Market Watch, August 2026, released September 3, 2026.
Have questions?
Want to know more about GTA Real Estate Market Watch – August 2026? Send me a message and I'll get back to you within 24 hours.